Everything the module does, in plain business language. Learn what each feature is, why it matters, and exactly how to use it โ step by step. No jargon, no guesswork.
Everything lives under one menu: Products โ Stock Intelligence
This version adds forward-looking planning built on your open customer orders, not just past sales. Great for project, installation, and build-to-order businesses.
Plan buying from signed, not-yet-delivered orders. See Net Available stock, shortfalls, and the exact "Buy-By" date for each product. Jump to section โ
Reorder Planning and Order Now now subtract committed customer orders and add incoming supplier orders โ a truer picture than physical stock.
The coming month's forecast can be floored by real committed orders due that month (shown as "+Book"), so demand is never under-counted.
A new dashboard tile flags money tied up in excess stock, and reorder points now respect each product's Dolibarr alert threshold.
Three settings and one Save. The module reads your existing Dolibarr data โ it never changes your products, stock, or orders. It is completely read-only and safe.
Go to Home โ Setup โ Modules, find Stock Intelligence, and switch it on. It then appears in the left sidebar under Products | Services โ Stock Intelligence.
Open Stock Intelligence โ Settings. Pick what counts as "demand":
How far back to look. 12 months suits a stable business; 6 months reacts faster if your demand changes quickly.
That's it. Open the Dashboard to see your first results. You can fine-tune the other 16 settings later โ see the Settings section.
Safe by design. Stock Intelligence only writes to its own two tables (its settings and its alert log). It reads everything else. Nothing leaves your server, and no core data is ever modified.
Why it matters: one screen tells you if your inventory is healthy or needs attention โ before you dig into details. Open it first thing each week.
Menu: Stock Intelligence โ Dashboard
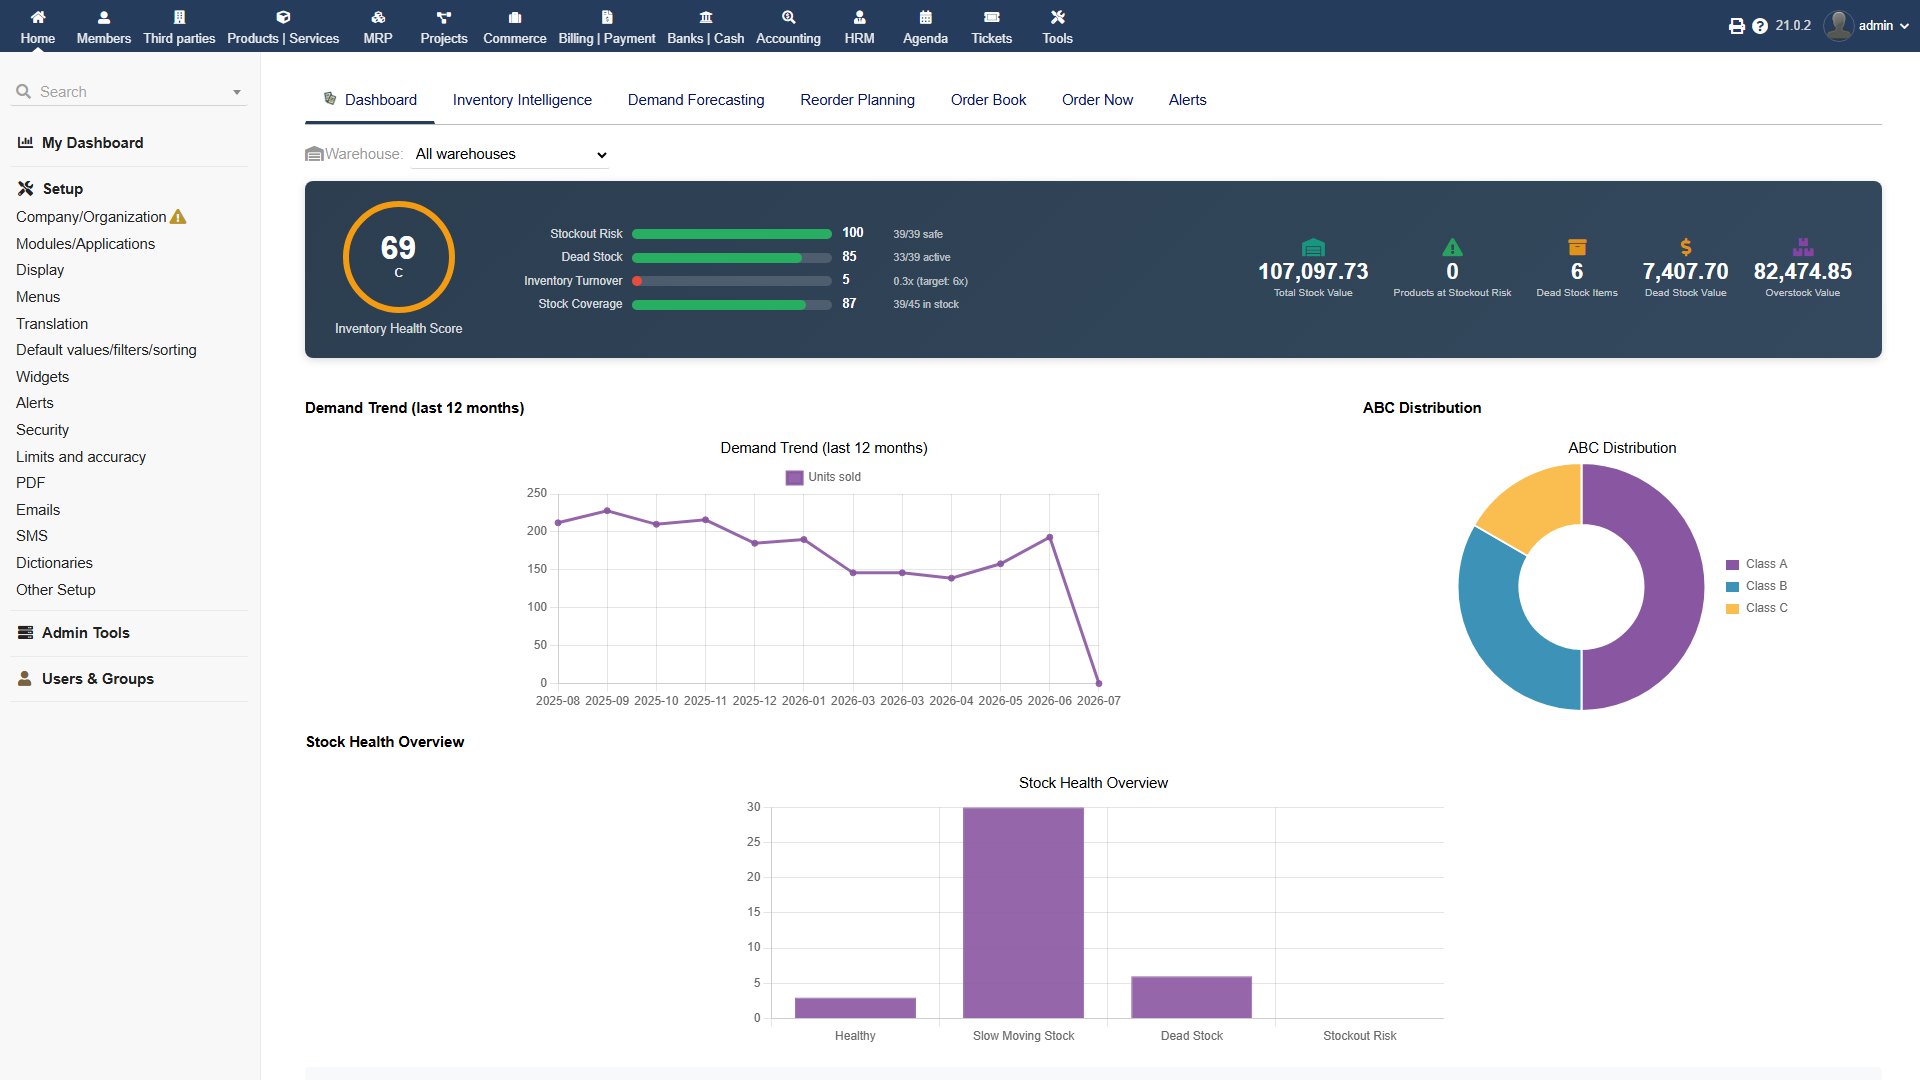
A single number for the overall health of your stock. Higher is better. It is the average of four equally-weighted parts (25% each):
How many products are close to running out. Fewer at-risk products raises the score.
How much stock hasn't sold in a long time. Less dead stock raises the score.
How quickly stock sells and is replaced. Faster turnover raises the score.
Whether stock levels match demand โ not too little, not too much. A healthy balance raises the score.
| Grade | A+ | A | B | C | D | F |
|---|---|---|---|---|---|---|
| Score | 90โ100 | 80โ89 | 70โ79 | 60โ69 | 50โ59 | Below 50 |
Aim for 70+ (Grade B or better). A low score means one or more of the four parts needs attention โ the charts below tell you which.
A line showing total demand month by month. Rising line = growing demand; plan more stock. Falling line = slowing down.
A pie showing how your products split into A, B, and C classes by revenue. Usually a small slice (A) drives most of the money.
Bars counting products that are Healthy, Slow, Dead, or at Stockout risk. Tall Dead/Stockout bars mean action needed.
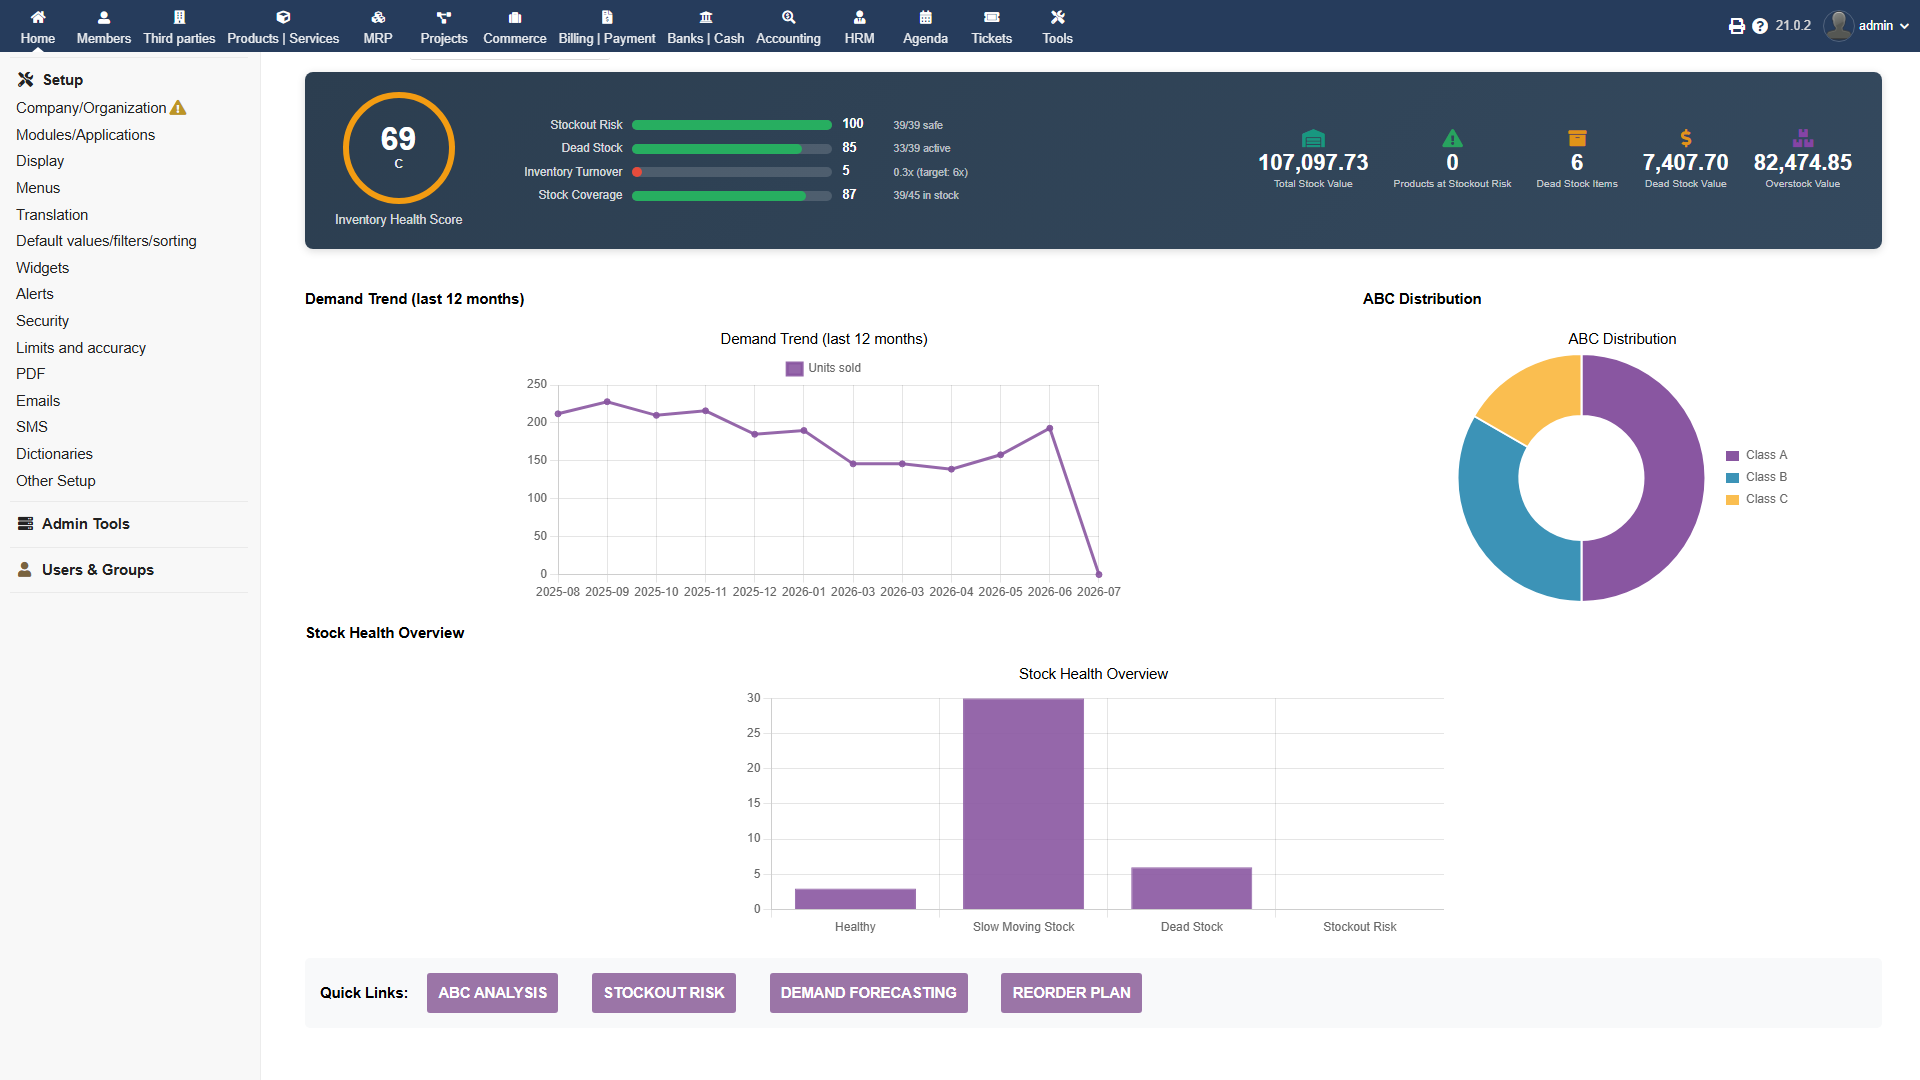
How to read it: the two value tiles turn cash you can't see into a number. High Dead Stock Value = money frozen in things that don't sell (discount or clear them). High Overstock Value = money frozen in things you bought too much of (slow down buying).
Why it matters: not every product deserves equal attention. These seven views sort your catalogue so you protect the winners, clear the losers, and spot risk early.
Menu: Stock Intelligence โ Inventory Intelligence โ pick a sub-tab across the top.
Ranks products by how much revenue they bring in, then splits them into three classes. The classic "80/20" rule made visual.
Measures how steady each product's demand is from month to month, using the coefficient of variation (a simple "bumpiness" measure โ how much sales jump around compared to their average).
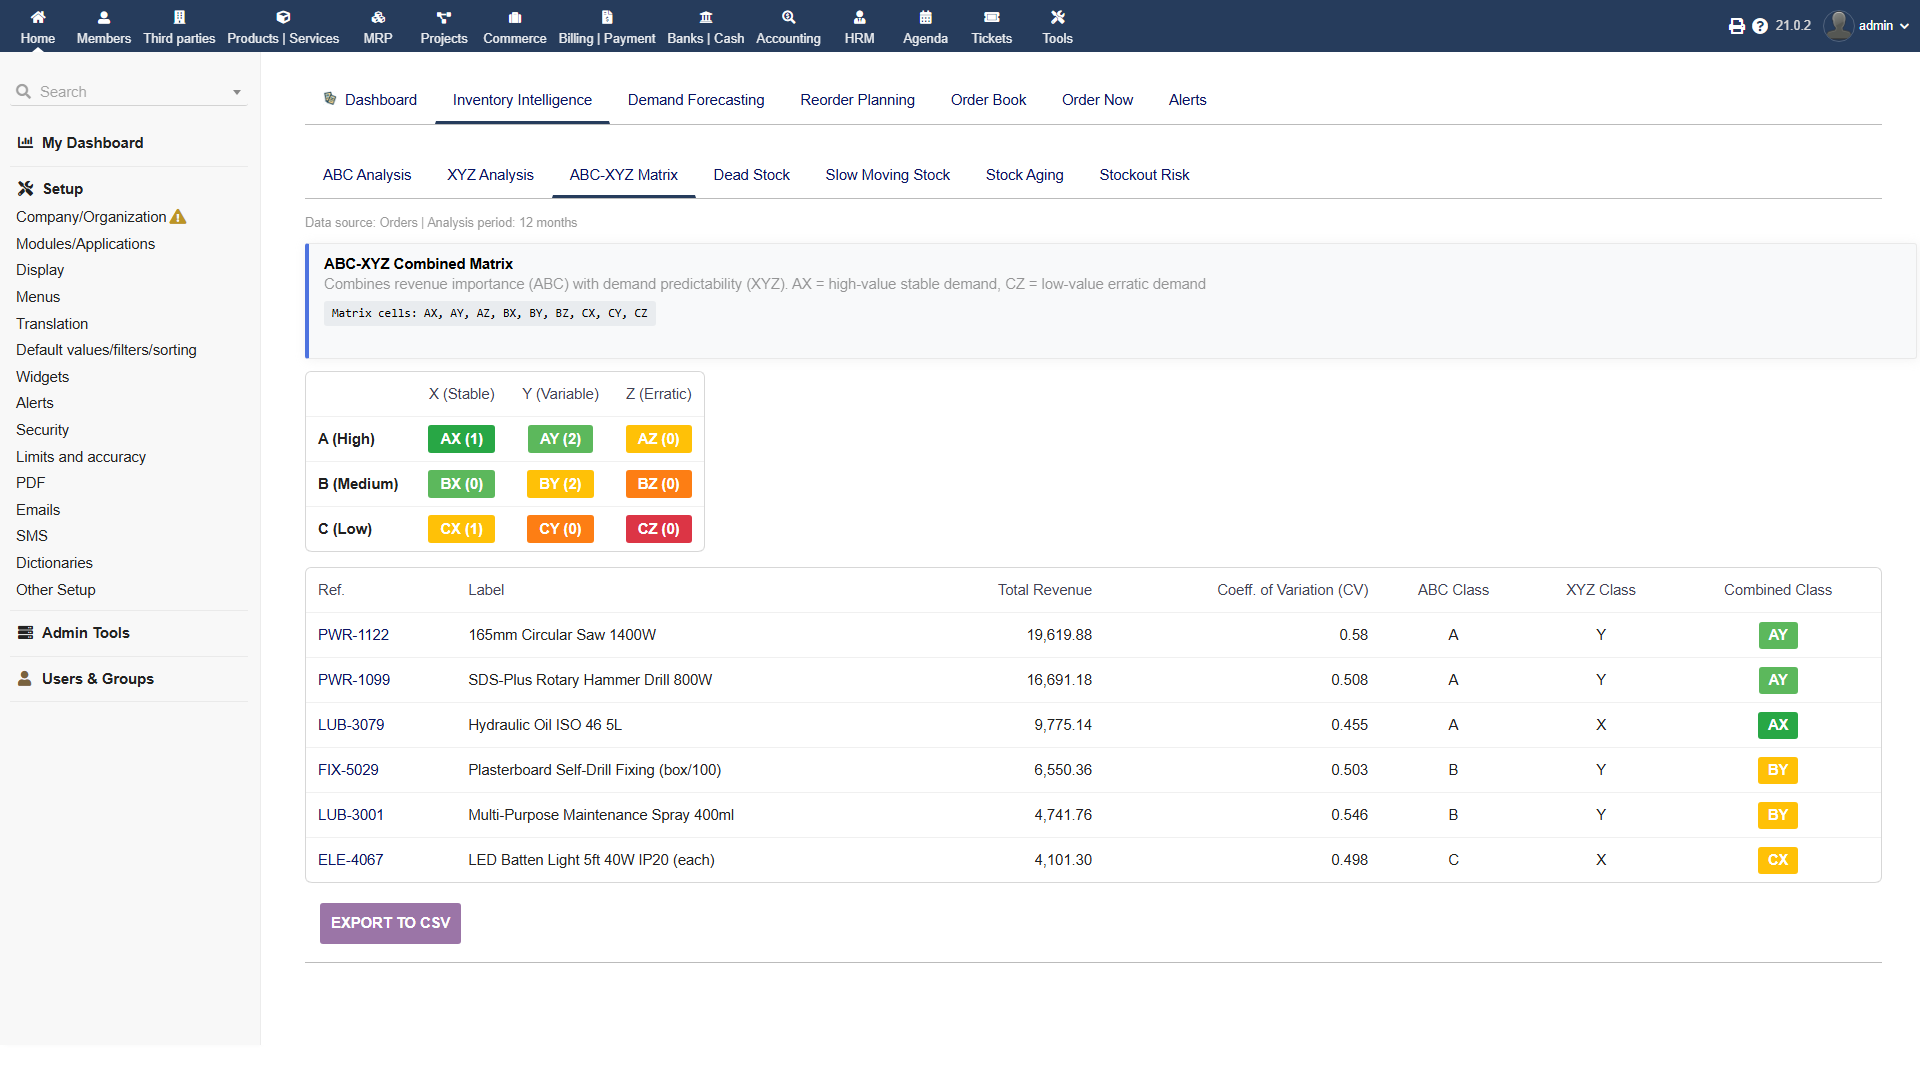
Combines the two above into a 3ร3 grid. It tells you where to spend your management effort.
| X (stable) | Y (variable) | Z (erratic) | |
|---|---|---|---|
| A (high value) | AX โ best: automate โ | AY โ watch closely | AZ โ tricky, keep buffer |
| B | BX | BY | BZ |
| C (low value) | CX | CY | CZ โ worst: minimise |
AX = high value + predictable โ the ideal, safe to keep well-stocked. CZ = low value + unpredictable โ hold as little as possible.
Products with no movement for N days (default 90). Shows the โฌ value stuck in each. Clear or discount these to free up cash.
Products with fewer than N movements over the period. Not dead yet, but sluggish. Review before reordering.
Days since stock last arrived (inbound), per warehouse. Old stock ties up cash and may expire or become obsolete.
Gives each product a Risk Score โ roughly, how many "lead times" of stock you have left. A low score means you'll run out before a new order can arrive.
A score below the threshold (set in Settings) flags the product as at-risk. Score under 1.0 means you'll likely stock out before replenishment lands.
Why it matters: knowing how much you'll likely sell next month lets you order the right amount โ not too much, not too little. The module offers several tried-and-tested methods and tells you how accurate each has been.
Menu: Stock Intelligence โ Demand Forecasting. See a bulk list of all products, or click one for a detail view with its monthly history chart.
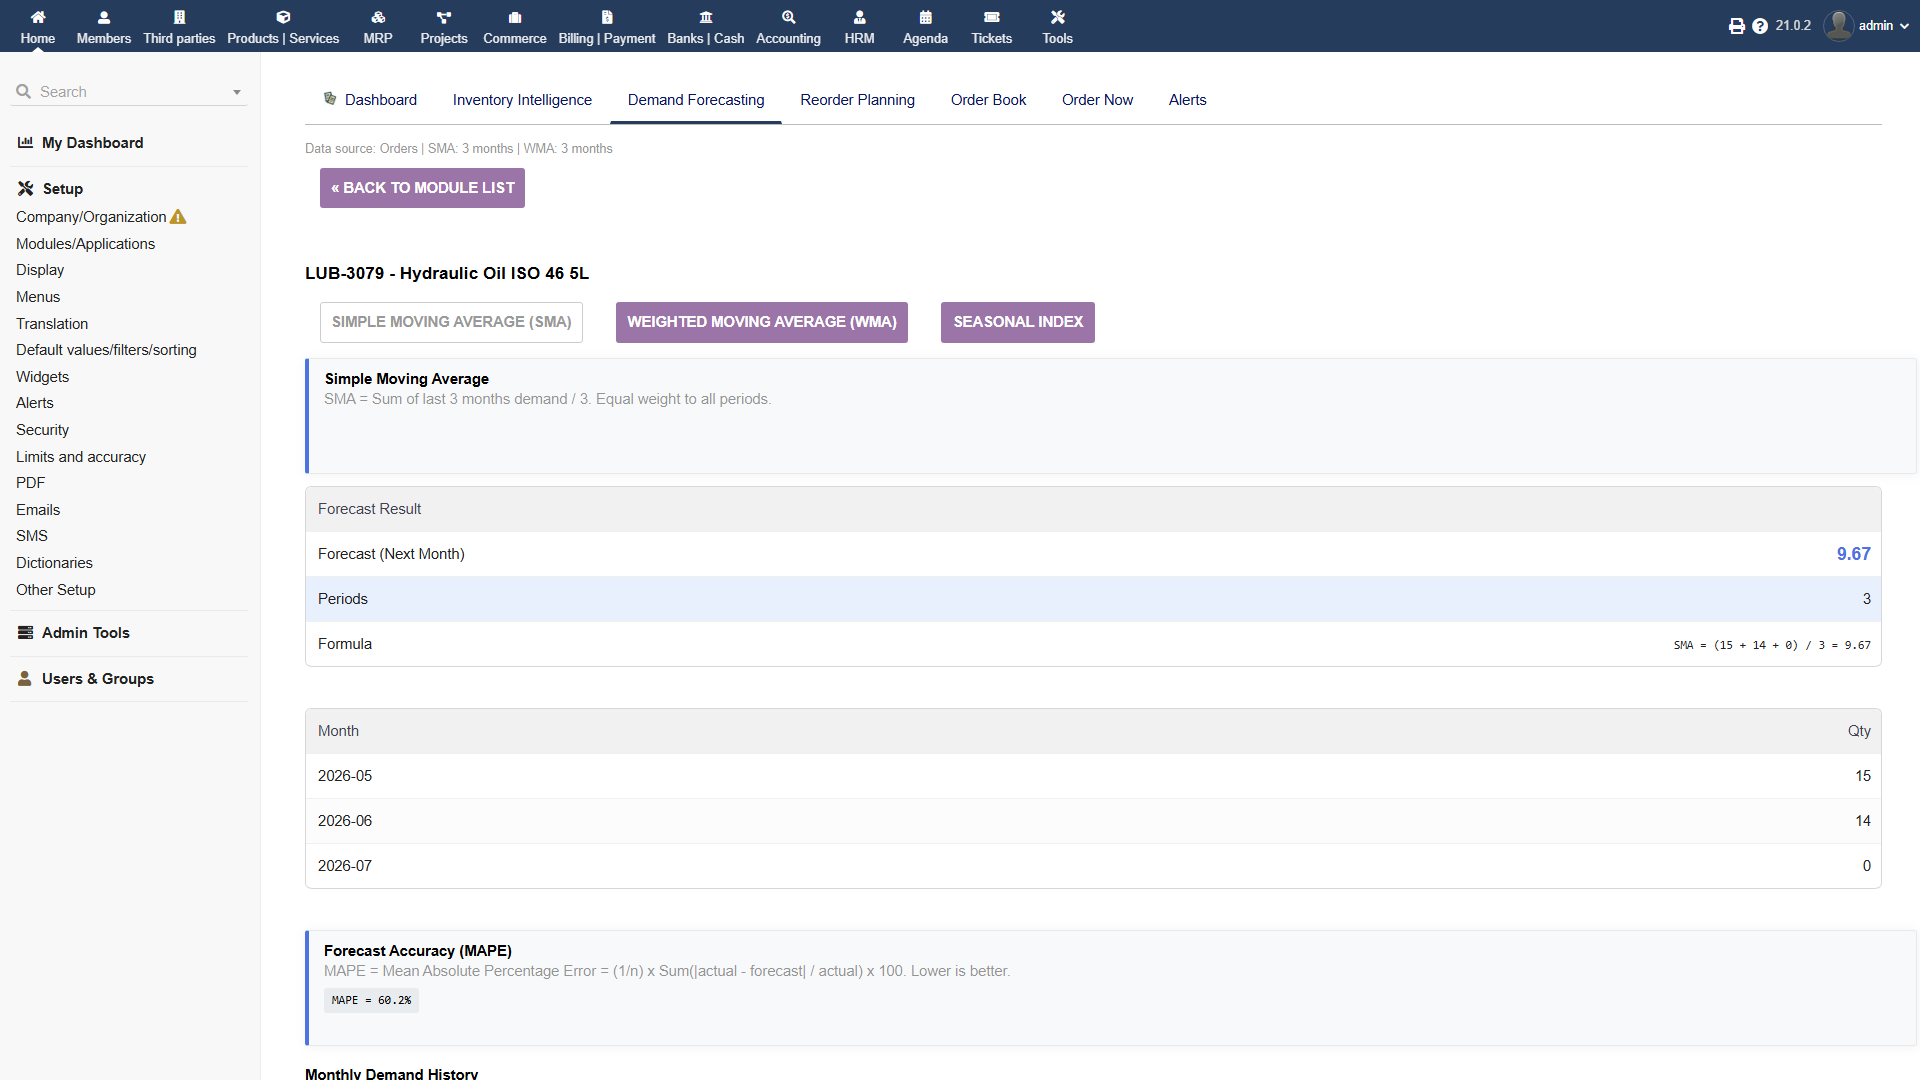
Averages the last few months equally. Best for steady products.
Like SMA, but recent months count more. Reacts faster to change.
Twelve monthly factors that capture busy and quiet seasons (e.g. December spikes). Great for seasonal goods.
Shows the average % error of past forecasts. Lower is better. Under 20% is good; over 50% means demand is hard to predict.
Turn this on in Settings โ Forecast Basis = Blended. Now the coming month's forecast can never fall below the real customer orders already booked for that month.
If history suggests 40 units but you already hold signed orders for 60, the forecast becomes 60 โ labelled +Book so you know it was lifted by real orders. This stops you under-buying when demand is already committed.
Good to know: forecasting works best with 3+ months of history. New products with little history will show low confidence โ lean on the Order Book instead (next section).
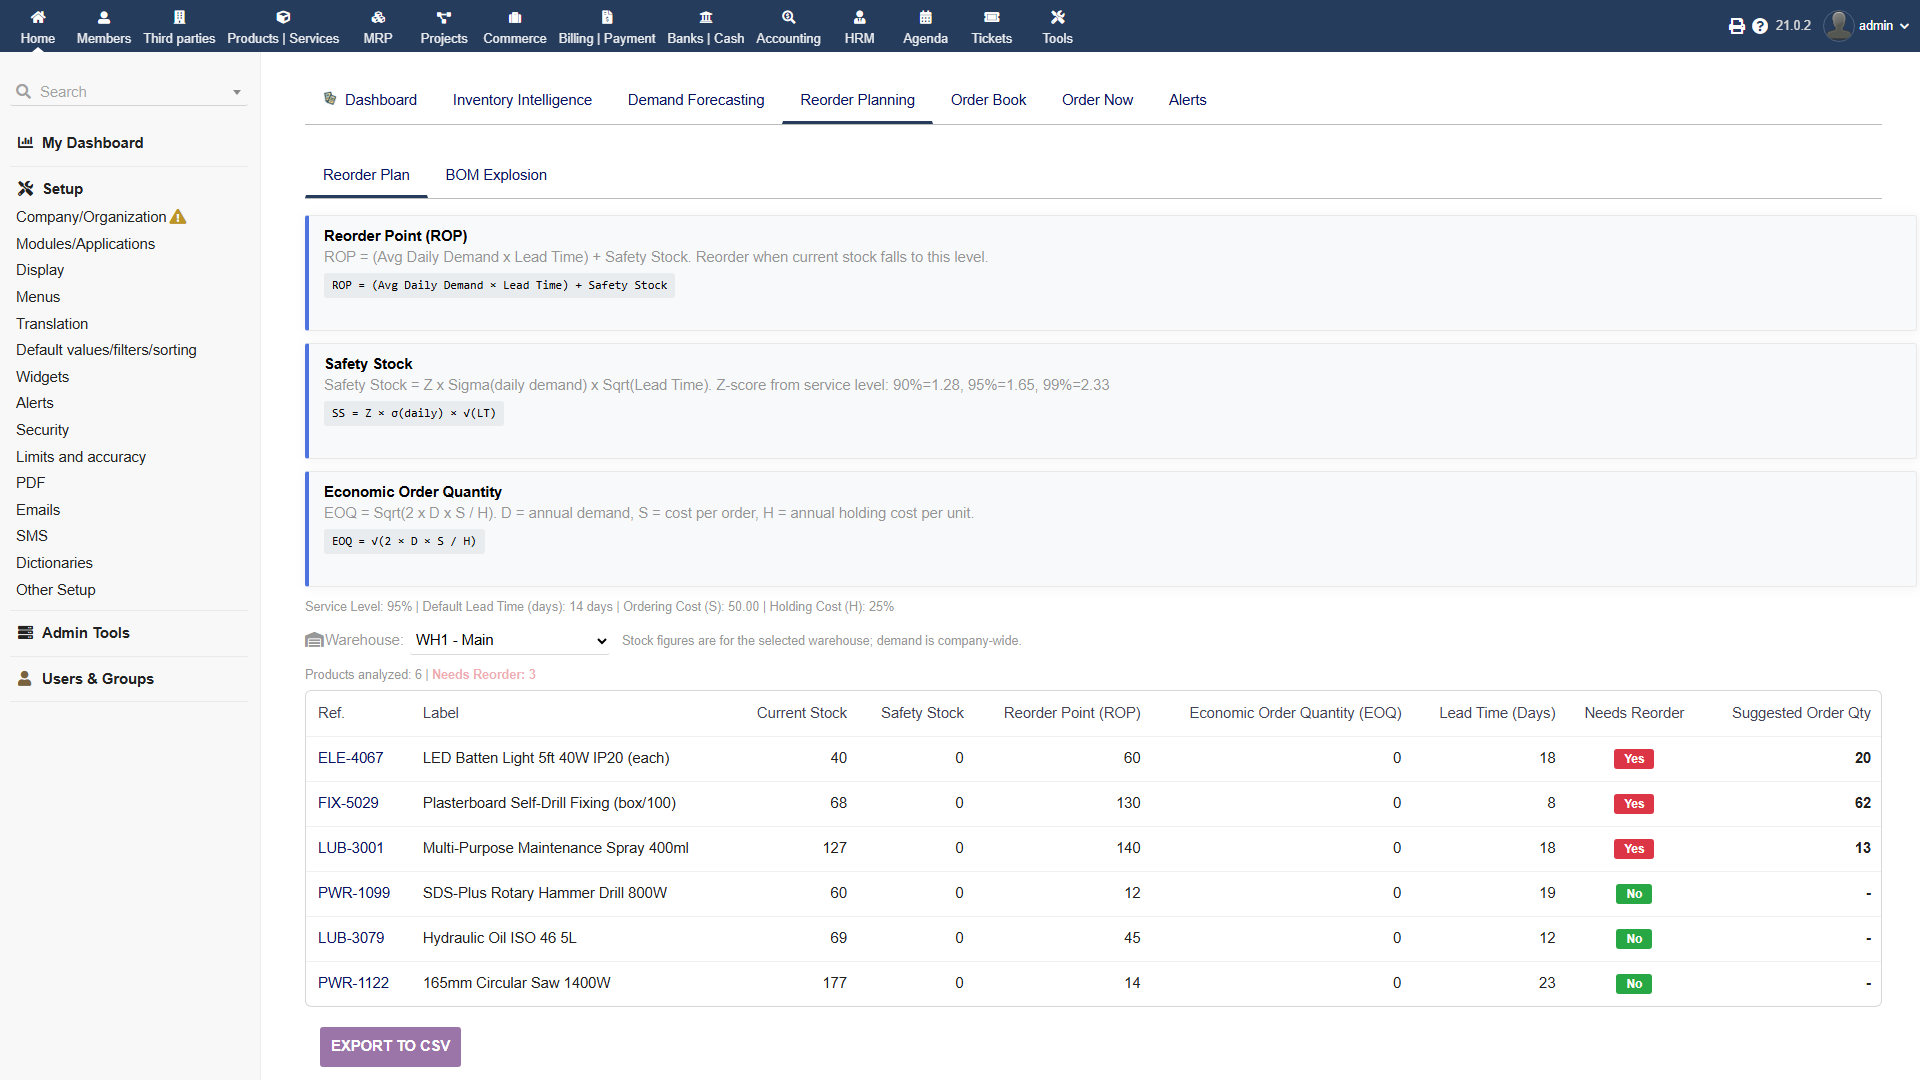
Why it matters: answers the two hardest buying questions โ when to reorder and how much. It uses proven inventory maths so you don't have to guess.
Menu: Stock Intelligence โ Reorder Planning (sub-tabs: Reorder Plan, BOM Explosion).
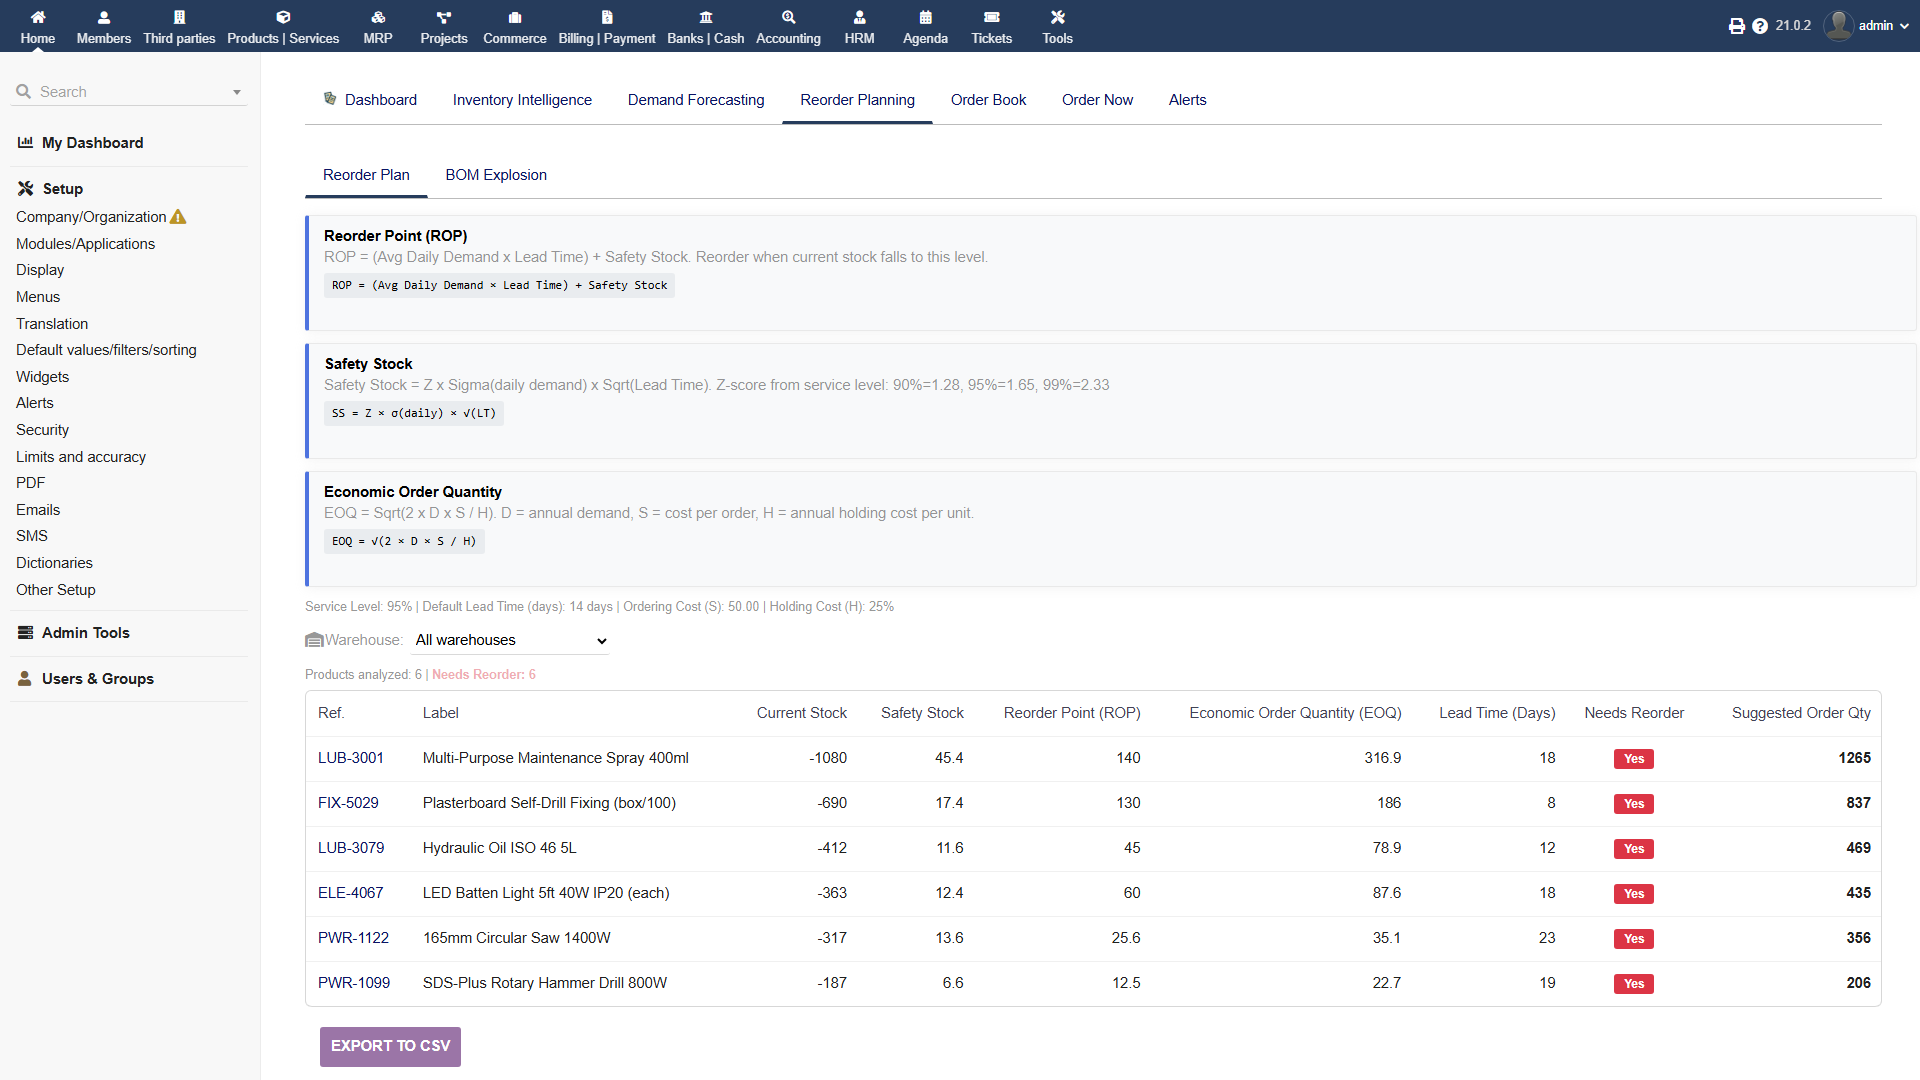
The stock level that triggers a new order. When you hit it, order โ the remaining stock should last exactly until the new delivery arrives.
A cushion that absorbs unexpected demand spikes or supplier delays. More buffer = fewer stockouts but more cash tied up.
The order size that keeps total costs lowest โ balancing the cost of placing orders against the cost of holding stock.
Order too often โ high ordering costs. Order huge batches โ high holding costs. EOQ finds the sweet spot.
If you build products from parts, this "explodes" a finished-goods requirement down to every raw material needed, following sub-assemblies recursively. Requires Dolibarr's MRP / BOM module to be enabled.
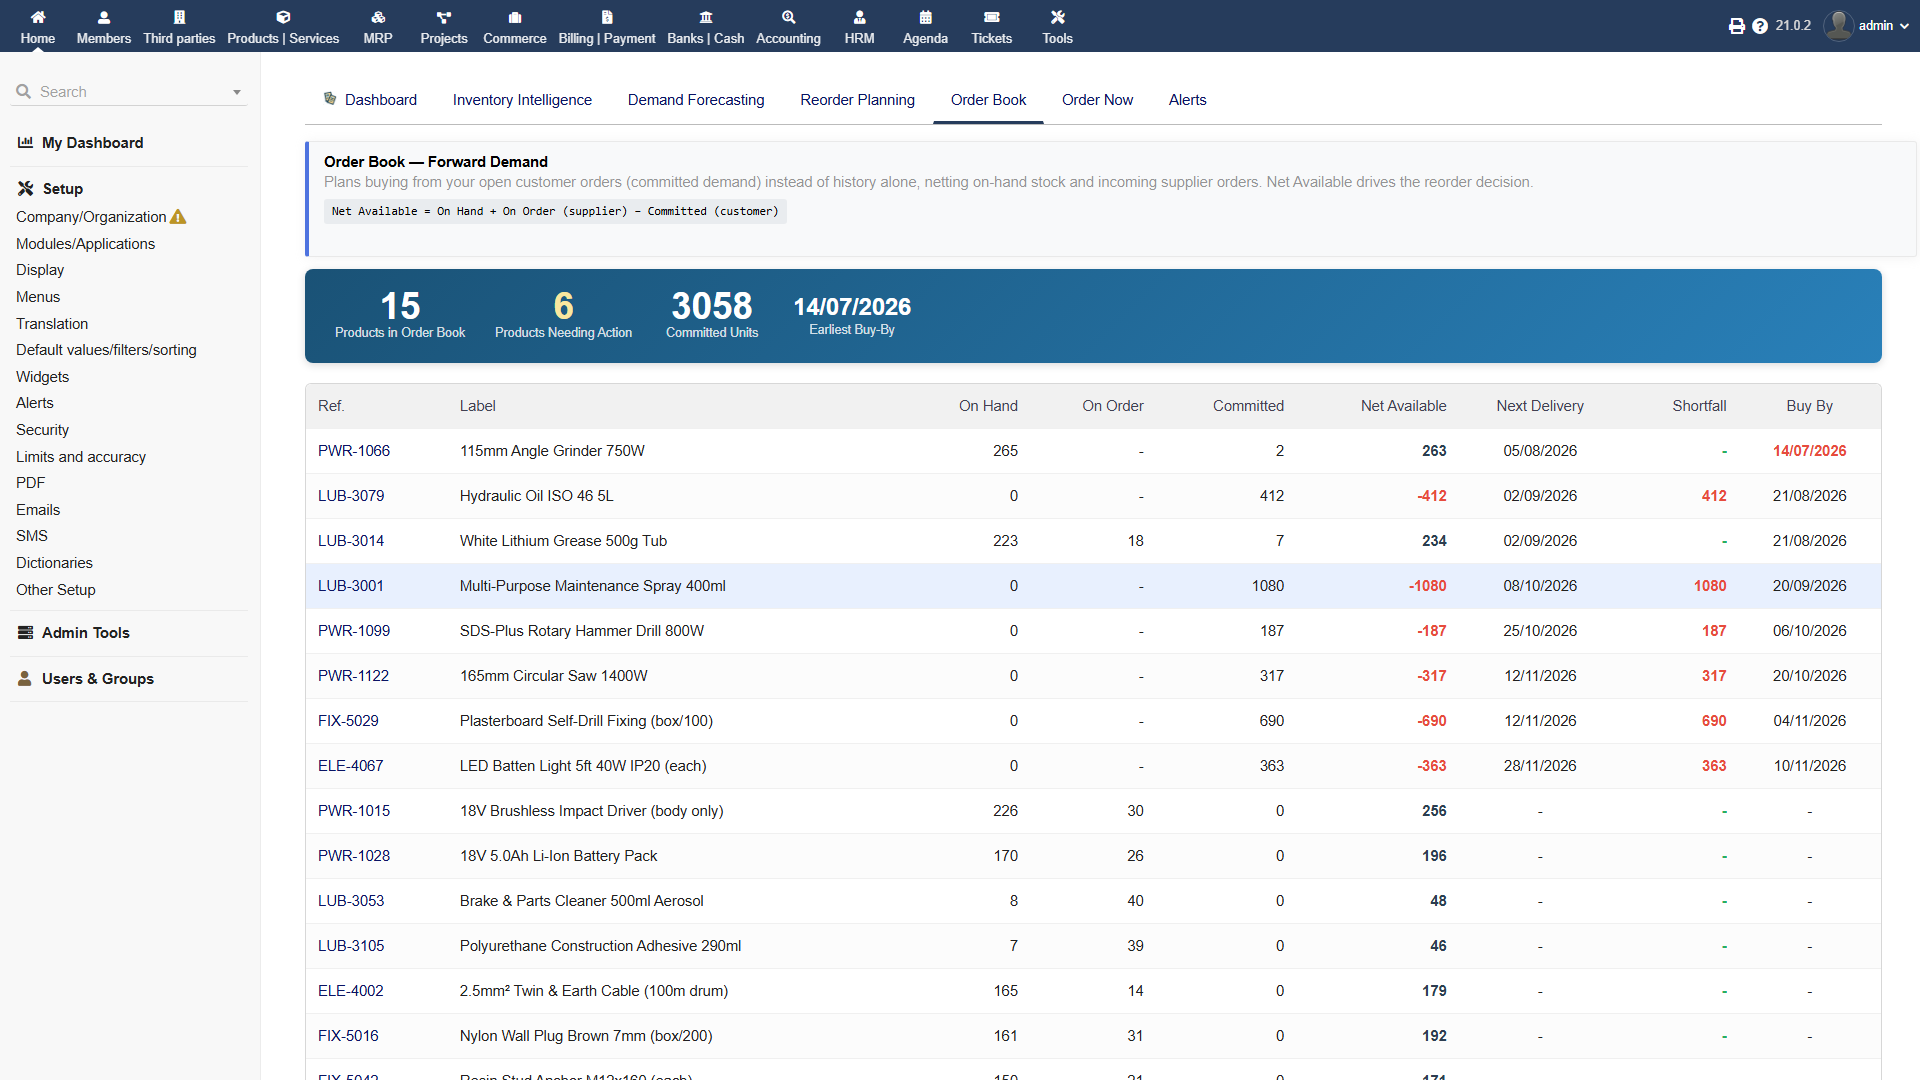
Why it matters: most tools plan buying from your past sales. The Order Book plans from your future โ the open customer orders you've already signed but not yet delivered. Perfect for project, installation, and build-to-order businesses, where a signed order for next month matters far more than last year's history.
Menu: Stock Intelligence โ Order Book
Physical stock on the shelf can lie. Some is already promised to customers; more is already on its way from suppliers. Net Available is the honest number โ what you can truly still sell or use:
Units physically in your warehouse right now.
Units on open supplier orders โ bought but not yet received.
Units on open customer orders โ promised but not yet shipped.
Rows are sorted by urgency; the most urgent (highlighted) sit at the top. Here's an illustrative example:
| Ref | Label | On Hand | On Order | Committed | Net Avail. | Next Delivery | Shortfall | Buy-By |
|---|---|---|---|---|---|---|---|---|
| PMP-200 | Water pump | 4 | 0 | 18 | โ14 | 05 Aug | 14 | 22 Jul โ |
| CBL-6 | 6 mm cable | 120 | 200 | 260 | โ60 | 18 Aug | 60 | 04 Aug |
| SW-32 | 32 A switch | 50 | 0 | 30 | 20 | โ | 0 | โ |
The last day you can place the order and still receive it in time to deliver. Miss it and you'll be late. Rows past or near their Buy-By are highlighted.
Click any product to see its future month by month, for the next N months (horizon set in Settings). For each month it shows incoming supply, committed demand, and where your stock lands โ flagging the month it goes negative, with a matching chart.
| Month | Incoming Supply | Committed Demand | Projected On-Hand |
|---|---|---|---|
| Start | โ | โ | 4 |
| July | 0 | 18 | โ14 โ goes negative |
| August | 20 | 0 | 6 |
| September | 0 | 3 | 3 |
How to read it: follow the "Projected On-Hand" column down. The first month it turns red is the month you'll run out โ order in time to fill that gap.
Set delivery dates. The Order Book needs your customer orders to have a Delivery date (Dolibarr's order field). Orders with no date are treated as due now, so they'll always look urgent.
Export CSV to hand the whole plan to your buyer, or to build purchase orders. Works even with no sales history โ it reads live open orders.
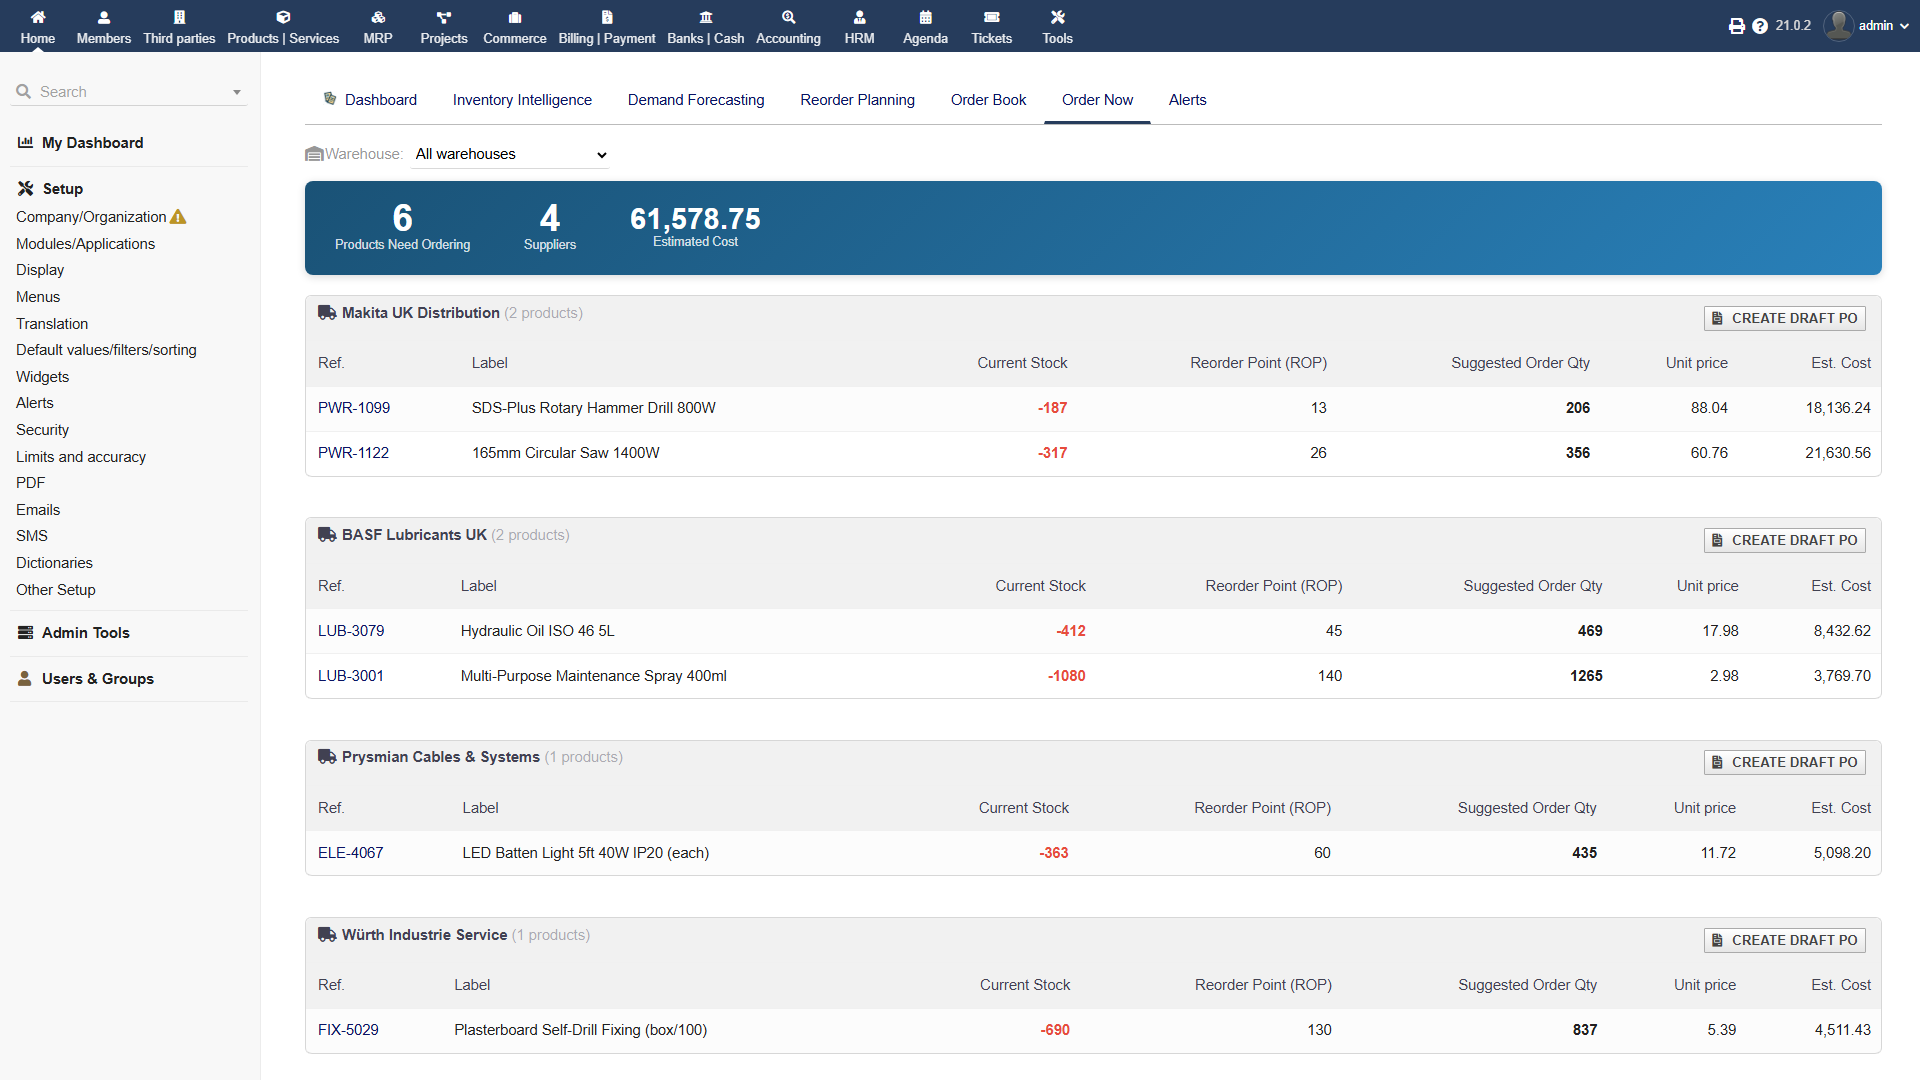
Why it matters: the shortest path from "what's low" to "purchase order". It lists every product below its reorder point, grouped by supplier, so you can raise one order per supplier in minutes.
Menu: Stock Intelligence โ Purchase Recommendations โ now its own left-menu entry (it used to be a tab only).
Order Now vs Order Book: use Order Now for routine replenishment driven by reorder points. Use the Order Book when specific signed customer orders drive your buying. Many businesses check both.
Why it matters: problems find you instead of you hunting for them. Get an email when something needs attention โ no need to log in every day.
Menu: Stock Intelligence โ Alerts
Warns when products are about to run out. Prevents lost sales.
Flags stock that isn't selling, with its โฌ value. Easiest win to act on.
Reminds you what's due for reordering, so nothing slips.
Enable the alert type you want.
Pick a frequency โ daily or weekly.
Enter a recipient list โ one or more emails (e.g. buyer@co.com, manager@co.com).
Click Test-send to confirm the email arrives, then Save.
Make them automatic: alerts are sent by a scheduled job. Add scripts/cron_alerts.php as a Dolibarr scheduled job (cron) so emails go out on their own. No spam โ if there's nothing to report, no email is sent.
Everything is tunable, but the defaults work well. Change these only when you understand your own numbers better than the averages. Grouped below for easy reference.
Menu: Stock Intelligence โ Settings
Every analysis view has an Export CSV button. Files are Excel-friendly and UTF-8 encoded, so accents and symbols display correctly. Use them to share with management, feed a spreadsheet, or build purchase orders.
The whole module is available in English, French, Spanish, and German. It follows your Dolibarr user language automatically โ no separate setting needed.
Fully compatible with Dolibarr's multi-company module. Every analysis โ dashboard, forecasting, reorder planning and the Order Book โ scopes strictly to the active entity, so each company sees only its own data.
Safe. The module is read-only against your core Dolibarr data. It only writes to its own two tables (its settings and its alert log). It never changes products, stock, or orders.
No. Everything runs locally on your Dolibarr instance. There are no external API calls. Email alerts use your own configured mail server.
Dolibarr's Products and Stock modules must be enabled. Database must be MySQL or MariaDB โ PostgreSQL is not supported. The BOM Explosion view additionally needs Dolibarr's MRP module.
Forecasting works best with 3+ months of order or invoice history. The Order Book needs no history at all โ it reads your open customer orders, so it's ideal for new products and project businesses.
Your customer orders probably have no Delivery date set. Undated demand is treated as due now. Add delivery dates to your orders in Dolibarr and the urgency and Buy-By dates become accurate.
Check your Data Source and Analysis Period in Settings, and make sure you have orders or invoices in that window. Ensure Products and Stock modules are enabled.
You've seen everything the module does. Install it and let Stock Intelligence tell you what matters, what's at risk, and what to order.